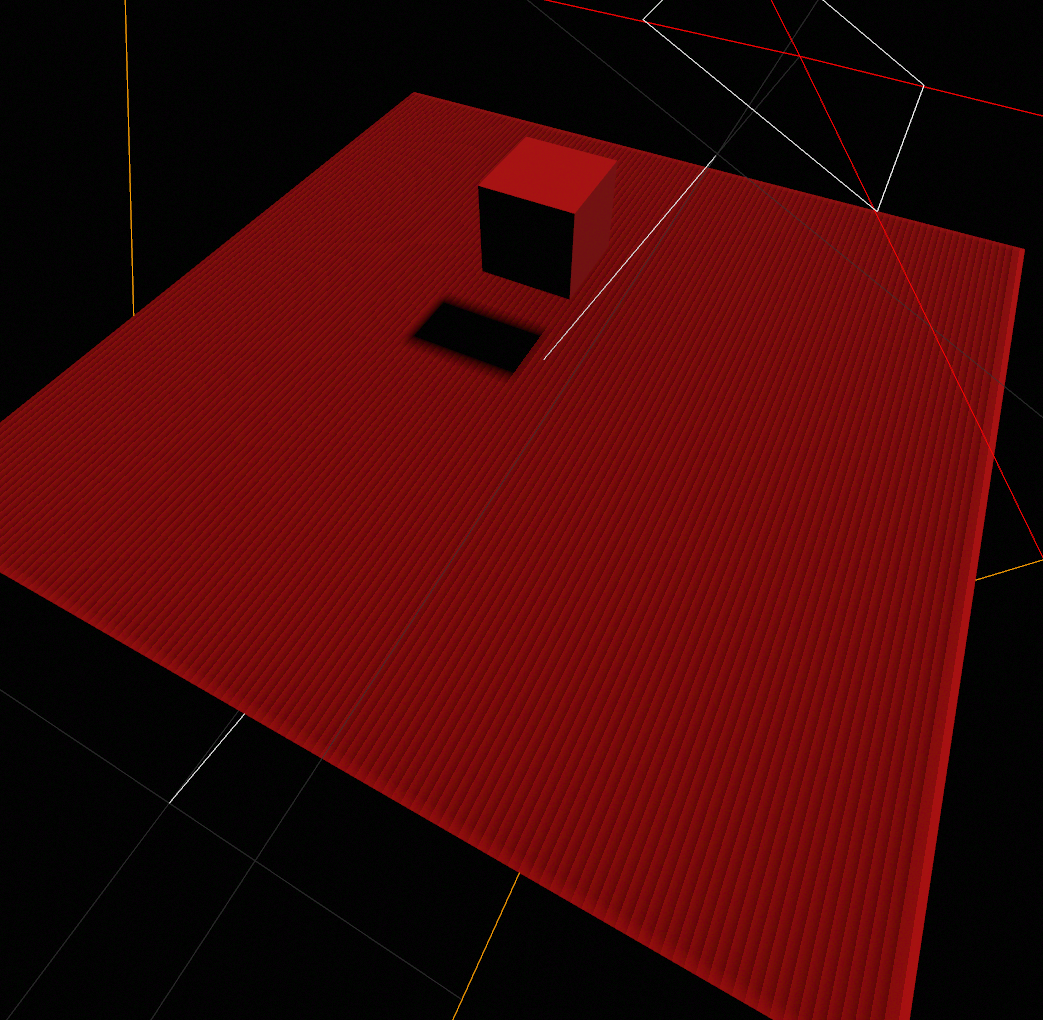
Triplanar Mapping is a method I make use of all the time in my 3D projects. Over time, I’ve experimented with tweaks and alterations to it with the goal of making it look better, run more performantly, and be useful in more situations.
The main change I present here is switching from using a linear mix of texture weights from each axis to a non-linear mix.
To explain what I mean by this, I’ll just show some code.